Authors: Maricar Rabonza, Rajitha Athukorala, Giuseppe Molinario
Both in-situ structural observations and larger area remotely-sensed imagery such as satellite and drone imagery play important roles in understanding the vulnerability of buildings to floods. In-situ structural observations of building characteristics,also known as vulnerability, contribute to the disaster management process by adding key information that is not available from satellite and aerial remote sensing data.
The coverage, however, is often limited for in-situ observations due to time constraints on the field. Consequently, some useful infrastructure information cannot be obtained. The use of omnidirectional (360-degree) imagery — a spherical photograph providing a 360° view around the photo location — is therefore of particular interest. It provides a cost and time-effective way to survey street-level building characteristics. 360-degree image collection bridges the gap between aerial maps and qualitative in-situ field work, such as gathering information by field teams using surveys. It enhances reconnaissance capabilities, ensures safer deployment of personnel to regions where risk is being evaluated, and provides multi-perspective information thereby overcoming the constraints of aerial nadir views.
Once the 360-degree imagery is taken, working with freely available platforms and tools — such as Mapillary — allows the imagery to be seamlessly uploaded to a geo-referenced map, in which the imagery can be navigated. This final product allows remote mappers as well as field teams to access street-level imagery of buildings and roads.
Methodology
1. 360-degree Street-Level Imagery Data Collection
Images were collected using 2 RICOH Theta S sensors mounted on a songthaew (a typical red “taxi-truck” used in Chiang Mai) or a motorcycle rider’s helmet. Simultaneously, a GPX track was recorded using a handheld GARMIN GPS unit as well as a Geoinformatics Center- (Global Navigation Satellite System (GNSS) integrity channel) assembled GNSS receiver unit.

Photos from Rajitha Athukorala & Maricar Rabonza.

2. Geo-tagging Images
The collected 360-degree imagery were then processed and the location of the images (i.e. Exchangeable File format (Exif)) were matched with the GPX tracks recorded based on the common time stamps, using a free software (in this case, Geosetter). The coordinates of the location where the images were taken were then written to each image’s Exif.
3. Uploading to Mapillary
The geo-tagged images were then reviewed for accuracy and uploaded to Mapillary.
Mapillary works in a way similar to Google Street View to give an immersive “walk through” of a landscape, allowing the audience to visualize uploaded images as navigable photo chains.
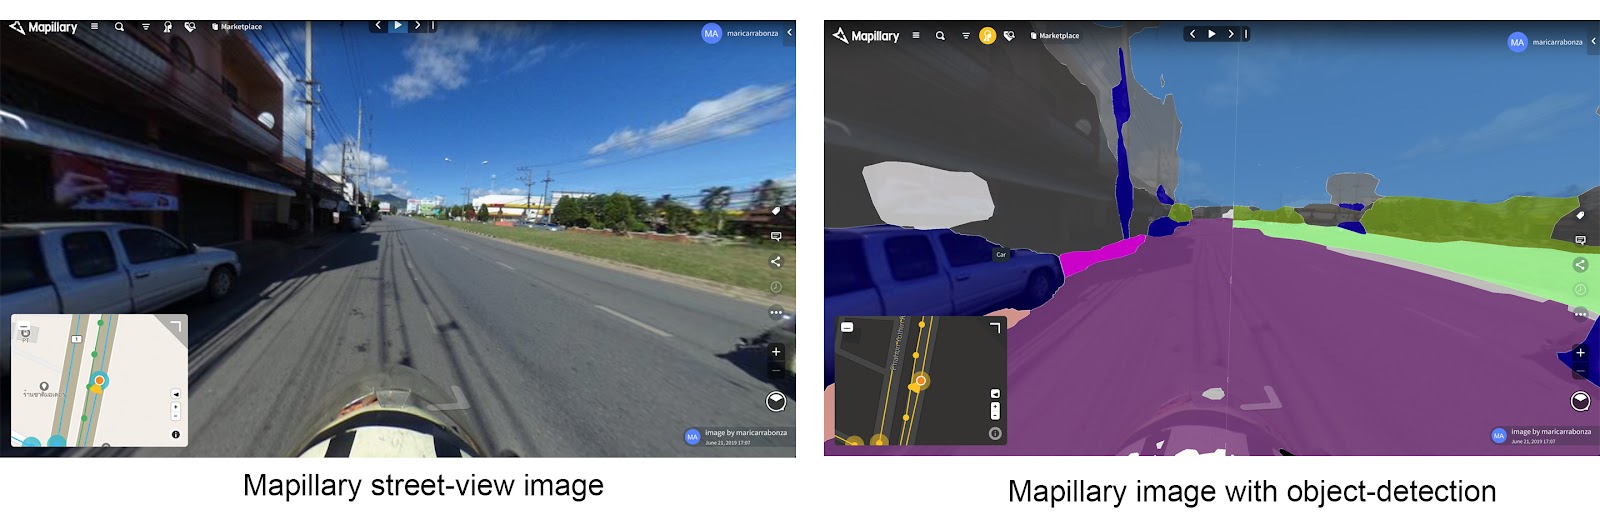
Built into Mapillary’s platform are machine learning algorithm that automatically blur human faces and vehicle number plates to comply with privacy regulations. Another feature built into Mapillary is automatic object detection that distinguishes and labels various objects (e.g. buildings, cars, roads, etc.) on the image via semantic segmentation.

Figure 4. (right) Using Mapillary with a browser; screenshot by Rajitha Athukorala.
Screenshots by Maricar Rabonza.
4. Digitizing using OpenStreetMap
Once the photos are uploaded to Mapillary, they can be used to provide additional information in the process of digitizing and editing features on OpenStreetmap. The photos are extremely useful as they provide street-level information that is not available from remotely-sensed satellite or aerial imagery (e.g. building type, number of floors, roof type, road conditions, etc.). All this information is key for vulnerability mapping. Finally, compared to standard surveying techniques, the use of semi-automated street-level image acquisition drastically reduces the amount of time field crews need to spend in the field. Having the street-level imagery free and openly accessible on Mapillary and OpenStreetmap also means the entire community can benefit from it.

Outputs
Mapping missions for three different flood-prone communities were conducted. Links to Mapillary photo sequences produced by these missions are provided and available for browsing. Each of these mapping missions were done in less than half a day.
Sequence 1 – Nong Hoi, Chiang Mai:

The first mapped area was located at Nong Hoi district in Chiang Mai, which is of interest to field lab participants working with the local NGO Forum for Older Persons Development (FOPDEV). Nong Hoi’s proximity just southeast of Ping River makes it particularly vulnerable to flooding.
Link to Mapillary photo sequence:
https://www.mapillary.com/map/im/wF7XgqlOxH6yeSi0aX4BZw
Data acquisition by Rajitha Athukorala and Giuseppe Molinario
Sequence 2, San Pa Tong, Chiang Mai:

The second day of mapping was conducted in a zone that coincides with the area of interest (AOI) where drone imagery was collected. This location is about a 45-minute drive south-west from the center of Chiang Mai. It was chosen due to its location, which lies outside of the extensive no-fly zones over Chiang Mai. This area is also flood prone during large rainfall events due to the flat topography and poor drainage. Having both drone and 360° imagery provides a great opportunity to take advantage of the strengths of both tools for understanding exposure and vulnerability for flood prone areas.
Link to Mapillary photo sequence: https://www.mapillary.com/map/im/pR62nSSG9qDs6Dvizc0h4g
Data acquisition by Rajitha Athukorala and Giuseppe Molinario
Sequence 3 – Mae Chan, Chiang Rai:

The team visited Mae Chan, near Chiang Rai, about 4 hours north of Chiang Mai. The main goal of the field visit was to install flood sensors that were developed in partnership with the OASYS lab of the engineering department of CMU during the field lab. A drone mission took place alongside the sensor-installation project, where some field lab participants took the opportunity to apply their newly learnt drone-mapping skills to obtain orthophotos and Digital Surface Models. A field survey conducted with the 360° camera also ran in parallel with these activities. The flood-prone areas covered are located along the Nam Mae Chan river.
Link to Mapillary photo sequence: https://www.mapillary.com/map/im/RlBFqFSz8G9gmrWr_8eL9w
Data acquisition by David Lallemant and Maricar Rabonza
Acknowledgements
This activity was done during the UR Field Lab Unconference in Chiang Mai, Thailand. Our thanks to Rajitha Athukorala for leading this workshop, Maricar Rabonza, Tian Ning Lim, Dr. Giuseppe Molinario, and the other participants in the 360-degree imagery collection and the workshops. Our thanks also to ISDSI for organizing the transportation for image-acquisition in Chiang Mai, and the OASYS lab for their support in image acquisition in Mae Chan. Lastly, we thank Dr. Kavinda Gunasekara (Senior Program Specialist- Geoinformatics Center, AIT) and Dr. Manzul Kumar Hazarika (Director- Geoinformatics Center. AIT) and for enabling this partnership.